
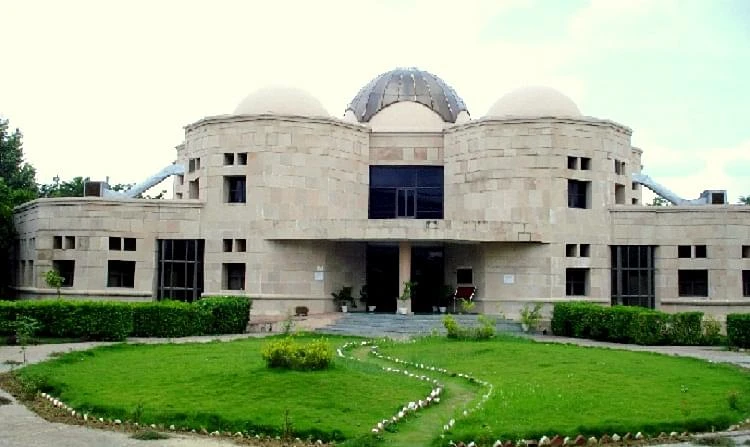



IIIT Allahabad placements: batch 2026 and historical NIRF cohorts
IIIT Allahabad publishes placement figures in two different formats: a placement-season page for its batch of 2026 and annual cohort rows submitted for NIRF. They answer different questions. The placement-season page uses registered students as its denominator and reports average CTC and highest CTC; NIRF’s Engineering disclosure reports graduates, placed students, higher-study selections and a median for cohorts within minimum stipulated time. The year, programme group and denominator should stay attached to each number when comparing outcomes.
Placement-season results for batch 2026
The institute’s Placement Statistics page, labelled for 2026, reports 615 registered students and 535 placed overall, or 86.99% of those registered. It separates 470 undergraduate students, of whom 433 were placed (92.12%), from 145 postgraduate students, of whom 102 were placed (70.34%). These are the page’s batch-2026 counts and percentages; they should not be described as placement guarantees for every student or programme. The overall 80-person difference between 615 registered and 535 placed describes only the two totals displayed on that page. It does not explain individual outcomes, indicate why a student was not recorded as placed, or cover students outside the registration denominator.
The same page lists an undergraduate average CTC of ₹33.35 lakh per annum and a highest CTC of ₹150 lakh. For the postgraduate group it reports an average CTC of ₹18.24 lakh and a highest CTC of ₹47 lakh. The average is not a median, and the highest figure describes the upper end rather than a typical offer. The institute page’s overall registered denominator includes the separate UG and PG groups, which sum to the published 615. Readers should use those denominator labels rather than dividing the placement count by total enrolment or comparing it with graduates reported in another dataset.
Historical four-year UG data submitted for NIRF
The Ministry of Education’s NIRF 2024 Engineering disclosure for IIIT Allahabad reports four-year undergraduate cohorts within minimum stipulated time. For 2022-23 it lists 384 graduates, 372 placed, a median salary of ₹30 lakh per annum and nine students selected for higher studies. For 2021-22 it lists 275 graduates, 261 placed, a ₹28 lakh median and 14 higher-study selections. For 2020-21 it lists 221 graduates, 190 placed, a ₹20 lakh median and two higher-study selections.
These are historical cohort rows in the institute’s NIRF submission, not batch-2026 recruitment-season counts. A graduate in the NIRF table and a student registered with the placement office are defined differently, and the time periods differ. Do not add the 535 batch-2026 placements to a NIRF cohort total or treat the ₹33.35 lakh average as directly comparable to a ₹30 lakh median. The NIRF higher-study count is also a distinct column: it records students selected for higher studies in that reported cohort and should not be merged with the institute page’s placed count. Each has a separate source, period and calculation basis. A higher-study selection is not the same as a placement, and neither count describes every enrolled student. Keep these measures in separate comparisons.
How the institute supports recruitment
IIIT Allahabad identifies its Student Career Progression Office as the interface for placement and internship opportunities and as a point of contact between students and recruiters. The office also describes formal recruiting conduct, including controls around dual offers and seat blocking. Applicants can use those policies to understand that recruitment is managed through institute procedures, but the page does not establish a particular student’s eligibility, shortlist probability or offer.
For a useful comparison, look for the exact programme group and graduating year, then ask whether the metric uses registered students or graduates and whether salary is reported as average or median. A placement rate is meaningful only with its denominator. Before comparing two colleges, check that both figures refer to the same degree level, cohort year and registration or graduation base. An overall figure can conceal differences among branches and programmes; no branch-level batch-2026 result is asserted here. A highest CTC should not be read as a likely outcome, and an institution-wide UG result does not show the result for ECE, IT or IT-BIn separately unless a source reports those branches. The available sources here do not provide a complete branch-level table for batch 2026.
Reading outcomes before choosing a programme
The 2026 placement-season figures provide a recent institute-level view split between UG and PG registration groups, while NIRF provides a longer historical view for specific four-year UG cohorts. Neither dataset forecasts the next graduating class. Students deciding between ECE, IT and IT-BIn should combine outcome evidence with the programme curriculum and their own interests; a placement average cannot substitute for academic fit or predict an individual result.
When reviewing a later update, check whether it changes the batch year, whether the institute has revised its registered or placed totals, and whether the group definition remains the same. If a future placement page gives a different average or highest CTC, it should not replace the NIRF median row. Keep each report’s publication year and scope visible, and use the Student Career Progression Office’s current recruitment policies for operational questions.